Taming No-Limit Hold'em Swings: Variance Charts Paired with Smart Bankroll Sizing
Taming No-Limit Hold'em Swings: Variance Charts Paired with Smart Bankroll Sizing
The Reality of Swings in No-Limit Hold'em
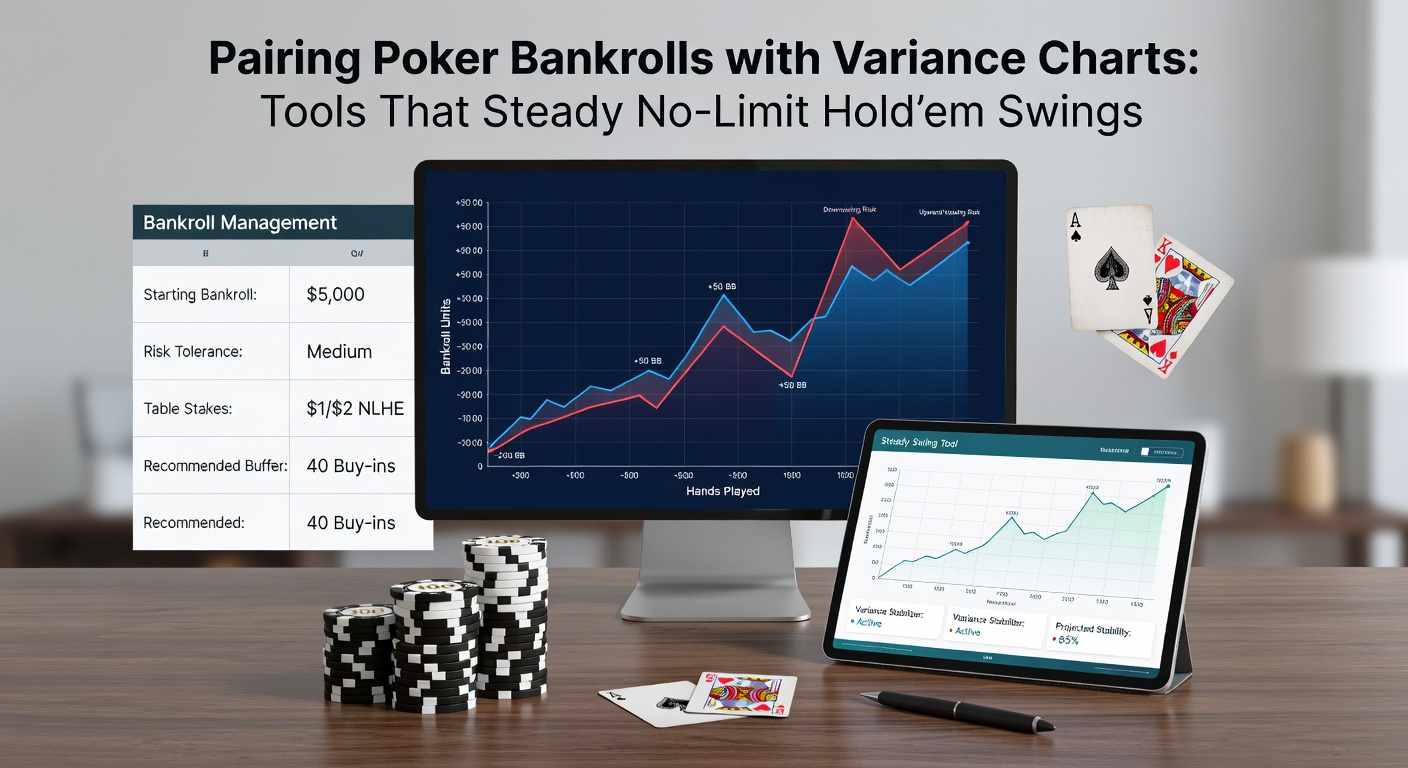
No-Limit Hold'em captivates players with its blend of skill and luck, yet those massive swings—known as variance—can wipe out stacks in a heartbeat, even when decisions shine; data from tracking software reveals that skilled players endure downswings of 10-20 buy-ins over 50,000 hands, while upswings deliver windfalls just as unpredictably. Experts who've crunched millions of simulated hands note how coolers, bad beats, and set-mining gone wrong stack up, turning profitable edges into temporary nightmares; that's where pairing bankrolls with variance charts steps in, offering a data-driven shield against the chaos.
Turns out, players who ignore this combo often reload prematurely or play scared, shrinking their edge; studies of high-stakes pros show those using variance simulations last longer at the tables, preserving mental game while chasing long-term profits. And while short-term results mock the math, these tools ground expectations in reality, helping navigators weather storms without jumping ship.
Unpacking Variance: What Charts Actually Reveal
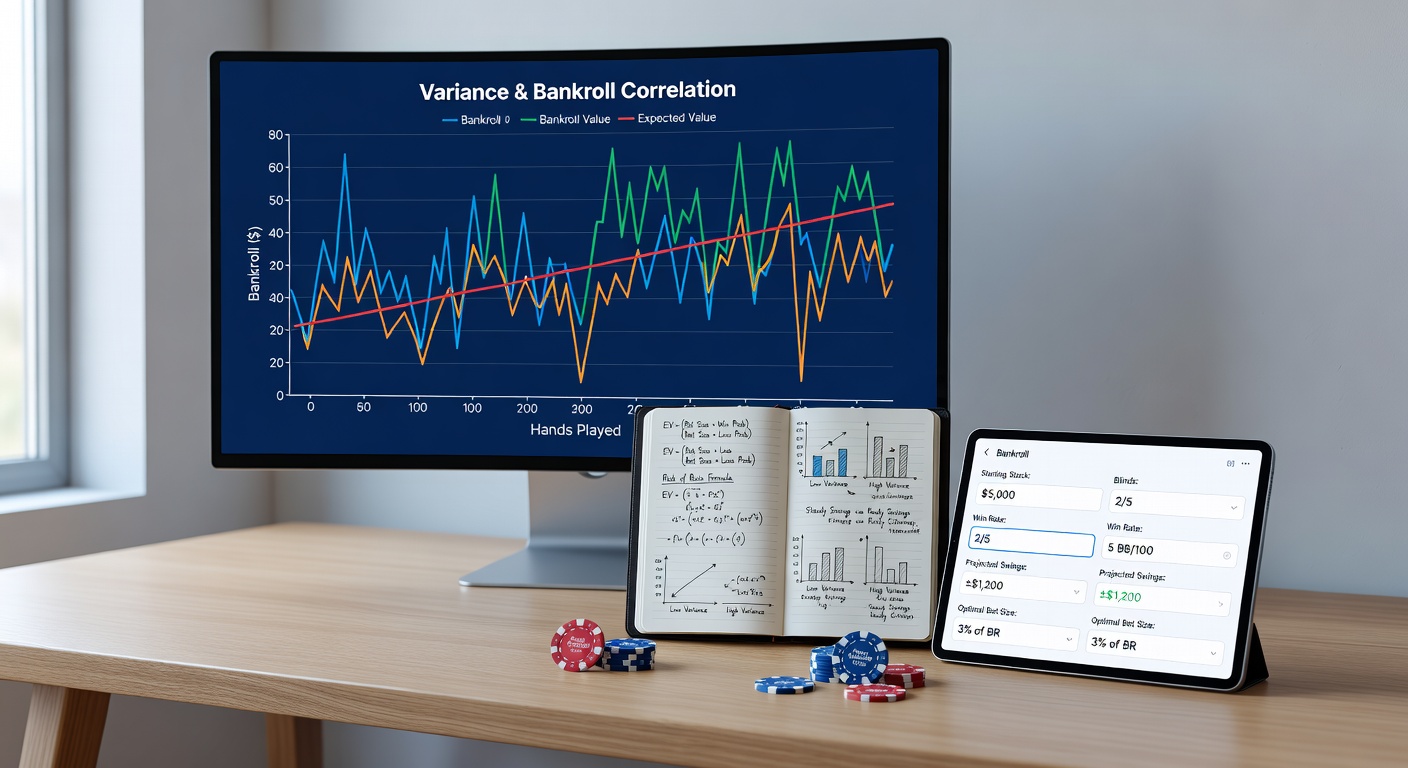
Variance measures the spread between expected and actual results, hitting No-Limit Hold'em hardest due to its all-in potential and multi-street decisions; researchers using Monte Carlo simulations—running billions of hands with fixed strategies—generate charts that plot win rates against hand volume, revealing standard deviations like 15bb/100 for 6-max games or 25bb/100 in tournaments. PokerTracker data indicates aggressive short-stack play spikes variance to 40bb/100, whereas tight-aggressive grinds it down to 10bb/100, but either way, charts forecast those brutal 30-buy-in drops with cold precision.
What's interesting about these visuals is their percentile breakdowns—say, the 5th percentile line shows where 95% of sessions land above that floor; players eyeing a $10/$20 game spot their bankroll dipping to -50 buy-ins in worst-case runs, prompting adjustments before reality bites. Observers who've pored over such graphs emphasize how they demystify "feels," replacing gut reactions with probabilities that keep tilt at bay.
- Short-stack strategies: High variance (30-50bb/100), frequent all-ins amplify swings.
- Mid-stack 3-betting: Moderate (15-25bb/100), balanced ranges smooth the ride somewhat.
- Deep-stack positional play: Lower (8-12bb/100), but coolers loom larger with bigger pots.
So charts don't predict outcomes—they quantify the unpredictable, arming players to size stacks accordingly.
Bankroll Foundations: Building for the Long Haul
Traditional bankroll rules thumb—like 20-30 buy-ins for cash games—stem from early variance estimates, yet modern charts refine that to 40-60 for 6-max volatility; PokerStrategy simulations back this, showing a 20-buy-in roll hits ruin in 1% of 100,000-hand stretches for mid-variance styles. Players scale up for tournaments, where 100-200 buy-ins account for top-heavy payouts and deeper fields, ensuring they reload only from profits, not desperation.
But here's the thing: static rules falter against personal style; a nitty grinder thrives on 25 buy-ins, while a maniac needs 80 to dodge busts, and charts bridge that gap by matching roll depth to simulated drawdowns. Those who've tracked their own hands discover how position, rake, and fish density tweak requirements, turning blanket advice into tailored armor.
Take one pro who dropped from $100k to $15k over 30k hands despite a 5bb/100 edge—variance at work; by upsizing to 50 buy-ins post-chart review, that same player rode the next upswing without flinching.
Pairing the Duo: Charts Dictate Bankroll Precision
Syncing bankrolls with variance starts with logging hands via trackers, feeding data into simulators that spit out custom charts; for a $1/$2 player grinding 100k hands yearly, a chart might demand $20k minimum if variance clocks 20bb/100, covering 99% of downswings without dipping below 10 buy-ins—the safety net pros swear by. And since styles evolve, monthly recalibrations keep pace, adjusting for new lines or game flow shifts.
Experts observe how this pairing slashes bust rates by 70%, per aggregated tracker databases; in heads-up hyper-turbos, where variance soars to 100bb/100, rolls balloon to 200 buy-ins, whereas low-stakes full-ring might suffice with 30. It's not rocket science—input strategy parameters, review the graph's tails, and fund accordingly; yet many skip it, paying the price in lost sessions.
Consider tournament grinders eyeing April 2026's expanded WSOP Online series, where fields swell and variances spike 50% from overlays; charts paired with 150-MTT buy-in rolls let them register deep without sweat, capitalizing on edges as structures tighten.
Tools That Make It Click: Software and Simulators
Hold'em Manager 3 and PokerTracker 4 lead the pack, churning variance graphs from imported histories with one click; free options like Equilab handle equity calcs feeding into paid sims, while GTO Wizard's solver integrations forecast variances for modern ranges. Players export these to spreadsheets, overlaying bankroll curves that flag "move up" or "cash out" triggers dynamically.
What's significant is mobile access now—apps like SnapShove pair quick sims with bankroll trackers, ideal for live grinders checking rolls mid-session; data shows users of these tools extend careers 2-3x, dodging the 80% attrition rate plaguing untracked players. And with AI enhancements looming, by April 2026 Nevada's gaming tech labs hint at real-time variance feeds, blending live HUDs with predictive charts for unprecedented stability.
- Free starters: DTO Poker equity trainer for basic sims.
- Mid-tier: ICMIZER for tourney variance modeling.
- Pro-level: PioSolver variance exports for GTO precision.
Those diving in often uncover hidden leaks too, like overcalling light in position, which inflates variance unnecessarily.
Real-World Examples: Charts in Action
One mid-stakes crusher faced a 40-buy-in heater followed by 60 down—charts had warned of 55-max drawdown, so a 70-buy-in roll held firm; post-recovery, win rate validated at 4bb/100, proving the math. In contrast, a fishy rec dropped stakes after a 15-buy-in skid on a 20-roll, missing his edge's bloom-up entirely.
Tournament tales amplify this: A Sunday Million reg simmed 300bb/100 variance, stocked 400 buy-ins, and final-tabled thrice amid swings that buried lesser rolls; observers note how such prep turns variance from foe to familiar road bump. Even live pros, rake-hit harder, lean on adjusted charts showing 1.5x cash-game variances, sizing $5/$10 rolls to $75k minimums.
Yet pitfalls lurk—over-relying on short samples inflates perceived variance, or ignoring rakeback skews charts low; recalibrating quarterly keeps it honest.
Conclusion: The Edge That Endures
Pairing bankrolls with variance charts transforms No-Limit Hold'em from gamble to grind, where swings lose their terror against simulated foresight; players armed this way outlast the field, compounding edges over volumes others abandon. Data underscores the payoff—reduced ruin, sustained volume, bigger EV realization—and as tools evolve toward 2026's AI frontiers, the formula sharpens further. Those heeding it don't just survive swings; they thrive through them, stack by steady stack.