Volatility Patterns in Modern Slot Designs: What Data Patterns Reveal About Payout Frequencies

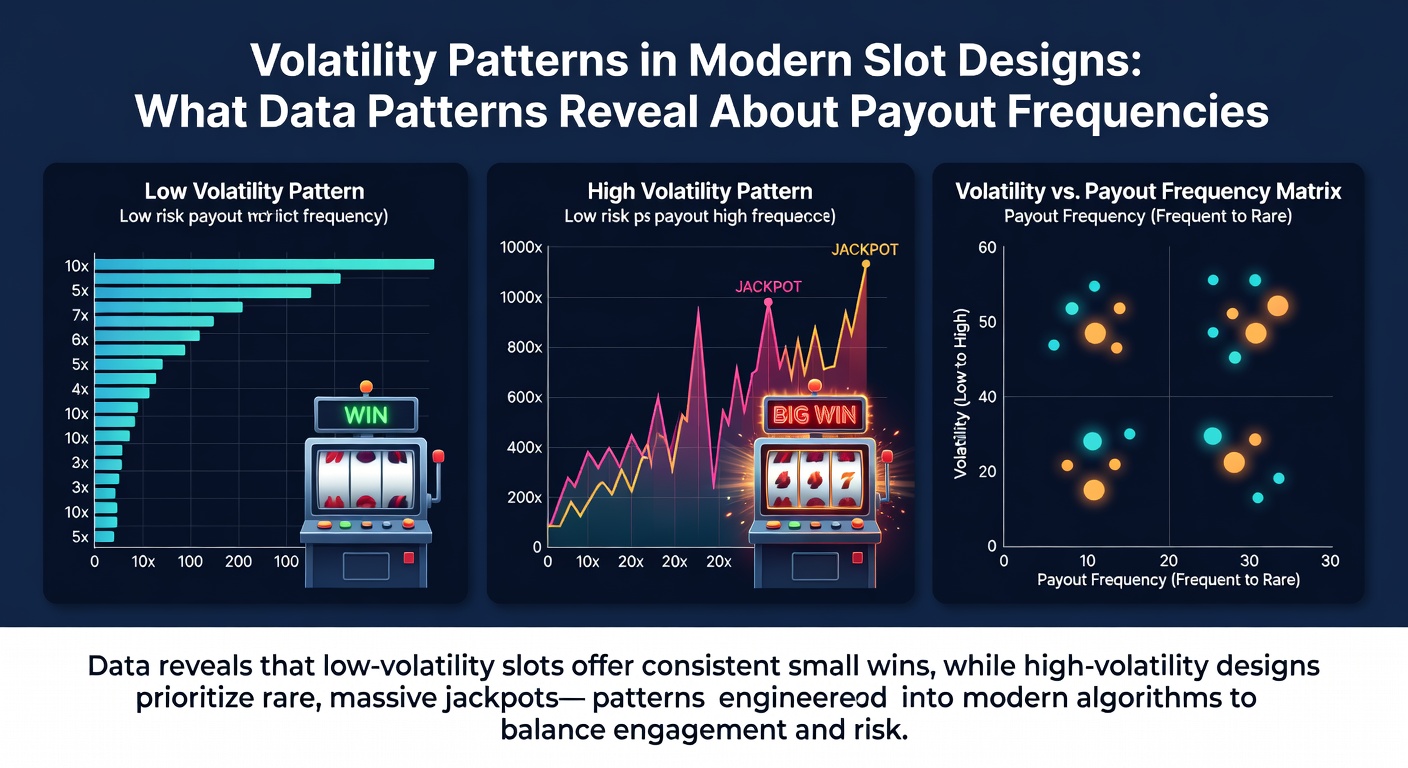
Modern slot machines operate on complex algorithms that balance return-to-player percentages with volatility levels, and data collected from multiple jurisdictions shows how these elements interact to shape payout frequencies over time. High-volatility titles tend to produce fewer but larger wins while low-volatility options deliver more consistent smaller returns, patterns that emerge clearly when analysts examine thousands of spins across different game engines.
Core Mechanics Behind Volatility Classifications
Slot volatility stems from the distribution of winning combinations within the game's random number generator framework, where designers adjust reel strips and bonus trigger rates to create distinct risk profiles. Research from academic institutions such as the University of Nevada, Las Vegas indicates that volatility ratings correlate directly with hit frequency metrics, with high-volatility games often recording hit rates below 25 percent compared to over 40 percent in low-volatility counterparts. These measurements come from aggregated session data rather than individual outcomes, allowing operators to calibrate player experience across large player bases.
Engineers incorporate weighted symbol distributions and progressive jackpot structures that further influence volatility curves, and recent analyses of game libraries reveal that many titles released after 2023 feature hybrid models blending medium volatility with occasional high-payout bonus rounds. Such designs aim to maintain engagement while satisfying regulatory requirements for transparent probability disclosure in markets like New Jersey and several Australian states.
Analyzing Payout Frequency Through Large-Scale Data
Comprehensive datasets compiled by gaming laboratories demonstrate that payout frequency follows predictable statistical distributions when examined across millions of spins, with standard deviation values serving as key indicators of volatility intensity. For instance, titles classified as high volatility exhibit wider payout swings, resulting in longer dry spells interrupted by substantial wins, whereas low-volatility games cluster outcomes more tightly around the theoretical return percentage. Observers note that these patterns hold steady across different themes and providers because the underlying mathematics remain consistent regardless of visual presentation.
Impact of Feature Integration on Volatility Curves
Bonus features including cascading reels, expanding wilds, and multi-level free spin rounds modify volatility by introducing additional layers of randomness that can either amplify or dampen overall variance. Data patterns extracted from operator reports show that games with frequent retrigger mechanics often shift toward medium volatility classifications even when base game reels suggest higher risk, a trend documented in technical evaluations conducted for licensing purposes. In June 2026 several international testing agencies updated their volatility assessment protocols to account for these layered interactions, providing operators with more granular metrics for player segmentation strategies.
Multipliers and buy-in options represent another variable that data analysts track closely because they alter the effective volatility experienced during a session. Studies from the Canadian Centre for Gaming Research highlight that optional bonus purchase mechanics tend to increase short-term variance while leaving long-term return-to-player figures unchanged, a distinction that appears in session-level telemetry collected from regulated platforms. Players encounter these adjustments most noticeably during extended play periods where feature frequency becomes statistically measurable.
Regulatory Frameworks and Reporting Standards
Government agencies across multiple regions require detailed volatility disclosures as part of game approval processes, and these requirements have produced standardized reporting formats that facilitate cross-jurisdictional comparisons. The New Jersey Division of Gaming Enforcement publishes aggregated statistics that illustrate how volatility categories distribute across approved slot libraries, revealing consistent proportions of high, medium, and low volatility titles year after year. Similar documentation from the Malta Gaming Authority demonstrates comparable distributions despite differing market conditions and player demographics.
Industry organizations such as the European Gaming and Betting Association compile voluntary benchmarks that further illuminate payout frequency trends, and these reports often include breakdowns by game type and volatility band. The resulting figures allow researchers to identify whether design innovations genuinely alter established patterns or merely repackage existing statistical behaviors under new themes.
Conclusion
Data patterns derived from extensive spin histories and regulatory filings continue to confirm that volatility remains a fundamental design parameter governing payout frequencies in contemporary slot machines. As testing methodologies evolve and reporting standards align across borders, analysts gain clearer visibility into how specific mechanical choices translate into measurable outcome distributions. These insights support both regulatory oversight and operational planning without altering the core randomness that defines each individual spin.